Core Services
Workflow Automation
At Octyma, we design automation solutions that simplify financial operations and corporate processes. Whether it’s automating CAPEX reporting, integrating financial data pipelines, or building real-time dashboards, we help businesses save time and operate with greater accuracy.
Workflow automation for finance & reporting
Data pipeline integration (Excel, Python, APIs)
Real-time dashboards & KPI monitoring
Automated CAPEX and financial close processes

Automation In Action
At Octyma, our automation solutions have already proven their value in real-world financial operations. Here are a few examples of how automation transformed business processes:
CAPEX Reporting → Automated monthly reports, reducing closing time by 40% and improving accuracy.
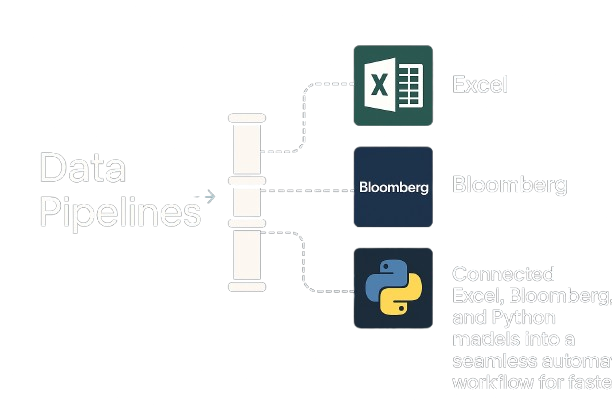
Data Pipelines → Connected Excel, Bloomberg, and Python models into a seamless automated workflow for faster insights.
Risk Reporting → Built real-time dashboards for VaR and stress testing, helping decision-makers respond instantly to market shifts.
Our approach follows a clear and repeatable framework:
Collect Data → Gather from spreadsheets, APIs, and databases.
Automate Workflow → Use scripts, triggers, and integrations to replace manual steps.
Generate Insights → Deliver results through dashboards and reports.
Optimize Decisions → Enable leadership to make faster, smarter, data-driven choices.
What You Gain From Automation?
Automation isn’t just about saving time — it’s about unlocking smarter decisions and sustainable growth. Here’s what businesses gain:
⚡ Faster Closing Cycles
Cut reporting time by up to 40%, accelerating monthly and quarterly closes.✅ Fewer Errors
Reduce manual input and reconciliation mistakes with automated workflows.📊 Real-Time Insights
Access dashboards and KPIs instantly, helping leadership act on live data.💰 Cost Efficiency
Streamline processes to lower operational costs and free up resources.🎯 Scalable Processes
Build flexible workflows that adapt as your business grows.